Beverages · Drink
Soda & Diet Soda
Sugar-sweetened and diet soft drinks (not a species) · also called Soda, pop, soft drink, cola, diet soda, diet cola, refresco, gaseosa
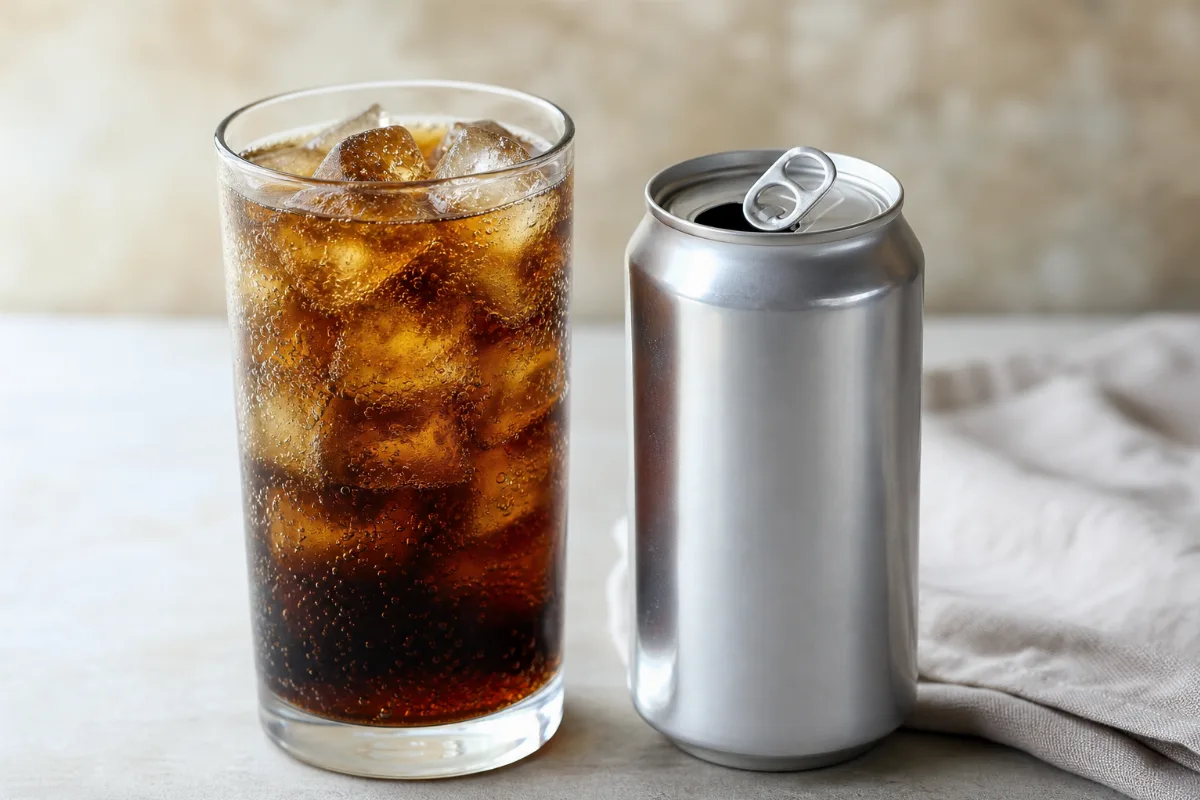
Soda is a fizzy soft drink. Regular soda is sweetened with sugar or syrup; diet soda uses low- or no-calorie sweeteners. We found no health benefit for either. Studies link regular soda to weight gain and a higher chance of type 2 diabetes. Evidence on diet soda is mixed, and WHO advises against sweeteners for weight control. The main cautions are sugar, teeth, caffeine in many sodas, and aspartame for people with phenylketonuria.
General information, not medical advice. Last substantive update · Not medically reviewed. A named clinician has not signed off on this page. How this page is made
About Soda & Diet Soda
Soda is a drink for taste, not a remedy. Regular soda adds sugar and calories, and pooled studies link it to weight gain and a higher chance of type 2 diabetes. Diet soda has no calories, but the evidence on weight and long-term health is mixed and mostly observational. The documented cautions are sugar, teeth, caffeine, and aspartame for people with phenylketonuria.
What is in a can of soda
Soda is a manufactured fizzy drink. The USDA regular item we read (a caffeinated pepper-type soda, older formula) has, per 100 g, 41 kcal, 10.4 g carbohydrate and 10 mg caffeine. One 12 fl oz can (368 g) has about 151 kcal, 38 g carbohydrate and 37 mg caffeine. USDA lists no total sugars for it, so we say carbohydrate.
The USDA diet item we read (a low-calorie cola-type soda with sodium saccharin) has 0 kcal and 0.1 g carbohydrate per 100 g. One 12 fl oz can (355 g) has 39 mg caffeine and 57 mg sodium. Many diet sodas now use aspartame or other sweeteners; brands and formulas differ.
Sugar and what the official limits say
WHO says free sugars should stay under 10% of daily energy, and that 5% or less may give extra benefit. A regular can has about 38 g of carbohydrate in the USDA item.
A 2013 pooled analysis found that adding sugar-sweetened drinks raised body weight in adult trials by about 0.85 kg, and that cohort studies linked them to weight gain in children and adults. These drinks as a group also went with more type 2 diabetes in cohort studies.
Diet soda and sweeteners
The American Heart Association writing group said diet drinks may help adults who drink many sugary drinks to cut calories, but evidence on harms is thin, and water is the best choice. WHO advises against non-sugar sweeteners for weight control, based on no long-term benefit for body fat. That advice is conditional and does not apply to people with diabetes.
In 2023 IARC classified aspartame as possibly carcinogenic (Group 2B, limited evidence), while the joint WHO/FAO committee kept its acceptable daily intake and the FDA has no safety concerns at approved use. People with phenylketonuria should avoid or restrict aspartame.
Caffeine in soda
Many sodas contain caffeine, but less than coffee. The FDA lists 23 to 83 mg in 12 fl oz of caffeinated soft drink and 113 to 247 mg in regular brewed coffee. Many sodas are caffeine-free, so check the label.
The FDA has cited about 400 mg a day from all sources as an amount not generally linked to negative effects in most healthy adults, with wide differences in sensitivity. The NHS limit in pregnancy is 200 mg a day.
Teeth, bones and kidneys
A 2026 pooled analysis of 24 studies found that fizzy drinks went with about twice the odds of tooth erosion in adolescents. A small mouth study found that a soft drink briefly lowered tooth-surface pH, which recovered within 10 to 15 minutes.
One 2006 study linked daily cola to lower hip bone density in women, and a 2013 study of three US cohorts linked sugar-sweetened soda to more kidney stones. Both are observational and cannot show cause.
Who should be most careful
Pregnant or breastfeeding people (caffeine), people with phenylketonuria (aspartame), people with diabetes or kidney stones, and young children. The FDA says drinks with no added sugars should be the first choice for children and teens, and caffeinated drinks should be avoided for children under 2.
Ask your doctor or pharmacist if you are not sure how soda fits with your health or medicines.
At a glance
Traditional uses history, not proof
- Drunk for taste and a quick lift from sugar and caffeine
- Long use as a drink is not proof that it helps any condition
Studied for research
- Body weight with regular soda, a risk (moderate certainty)
- Type 2 diabetes and metabolic syndrome with regular soda, a risk (low certainty)
- Diet soda and weight control, mixed
- Diet soda and later diabetes or heart disease, an association (very low certainty)
- Cola and hip bone density in women, an association (very low certainty)
- Kidney stones with sugary soda, an association (low certainty)
- Tooth erosion in adolescents, an association (low certainty)
- Any health benefit of soda: insufficient evidence
Main compounds
- Sugars and other carbohydrate
- Caffeine (in many sodas)
- Non-sugar sweeteners (aspartame, saccharin and others)
- Phosphoric acid and phosphorus (colas)
Common forms
- Regular (sugar-sweetened) soda: USDA item read
- Diet or zero-sugar soda: USDA item read, saccharin formula
- Caffeine-free versions were not read
Research links: 2013 review: sugar-sweetened drinks and weight gain · 2015 review: sweetened drinks and type 2 diabetes · 2018 American Heart Association advisory on diet drinks · Research Library · Genes & Biomarkers Library
What it is and its history
- Accepted scientific name
- Soda and diet soda (manufactured carbonated soft drinks)
- Common names
- Soda (English); Pop (English); Soft drink (English); Cola (English); Diet soda (English); Refresco (Spanish); Gaseosa (Spanish)
- Family or group
- Beverages: carbonated soft drinks. The nutrient summary files them under 'other beverages'.
- Harvest and processing
- Soda is a manufactured drink. The sources we read do not describe how it is made. The USDA items read are a caffeinated pepper-type soda and a low-calorie cola-type soda sweetened with sodium saccharin. Many diet sodas now use aspartame or other sweeteners; we did not read data for those.
- Look-alikes and adulterants
- Name: Sparkling or mineral water; Note: Carbonated but with no sugar or sweetener; a separate page covers it.; Name: Energy drinks; Note: Caffeinated soft drinks with more caffeine and added ingredients; a separate page covers them.; Name: Sports drinks; Note: Sweetened drinks with added salts; a separate page covers them.
Photographs
What is inside, and how it may work
What it contains and how those compounds act in cells and animals. Laboratory and animal mechanisms are not proven effects in people.
Main compounds
| Compound | Family | Where it is concentrated | Activity studied | Level of evidence |
|---|---|---|---|---|
| Sugars and other carbohydrate | carbohydrate | Added in manufacture (type of sweetener not stated in the USDA item) USDA regular item: 10.4 g carbohydrate per 100 g (about 38 g in a 12 fl oz can); no total sugars value listed | Supplies energy. The regular item has about 41 kcal per 100 g. 15 | Human data |
| Caffeine | methylxanthine | Added or from flavourings (not stated in the sources read) USDA: 10 mg per 100 g (regular) and 11 mg per 100 g (diet); FDA: 23 to 83 mg per 12 fl oz of caffeinated soft drink | A stimulant. The FDA lists its signs when taken in excess. Many, but not all, sodas contain it. 15 14 12 | Human data |
| Non-sugar sweeteners (aspartame, saccharin and others) | intense sweeteners | Added in manufacture The USDA diet item uses sodium saccharin. WHO's example for a diet soft drink is 200 to 300 mg of aspartame per can. | Give sweetness without calories. Aspartame is a source of phenylalanine (see Safety). 14 16 11 | Human data |
| Phosphorus (phosphoric acid in colas) | mineral | Added in manufacture USDA: 11 mg per 100 g in both items. The Framingham abstract names phosphoric acid as a cola ingredient. | Contributes acidity. Not shown to harm bones in the abstract read. 15 14 10 | Human data |
Mechanisms, receptors and pathways
| Target or pathway | Gene or receptor | What was found | Level |
|---|---|---|---|
| Acid on tooth surfaces | Not applicable | In a small lab and mouth study every drink except water briefly lowered tooth-surface pH; recovery came within 10 to 15 minutes. The soft drink tested had the lowest starting pH. The authors say this indicates acidity, not tooth loss. 3 | Lab and human short term |
| Calcium-to-phosphorus balance and bone | Not applicable | In daily cola drinkers the calcium-to-phosphorus ratio was lower, and hip bone density was lower in women. This is an association; the authors name caffeine and phosphoric acid as possible reasons without showing them. 10 | Observational |
| Sugary drinks and body weight | Not applicable | No mechanism is given in the abstracts read. Trials show that adding sugar-sweetened drinks raised weight. 8 | Human trials |
Absorption, metabolism and elimination
- Absorption
- Not found in the sources read.
- Distribution
- Not found.
- Metabolism
- The FDA says people differ widely in how fast they clear caffeine. Aspartame is broken down to phenylalanine, which people with PKU cannot process normally (FDA).
- Elimination
- Not found.
- Bioavailability
- Not established.
Isolated compounds versus whole extracts
This page is about the drink as sold. Results for sugar-sweetened drinks as a group, or for sweeteners in all foods, are labelled where they differ from soda alone.
Nutritional composition
Nutrition from USDA FoodData Central (SR Legacy, April 2018 release), read from the saved USDA copy. These are two older branded-type items, not every soda. Regular item (FDC 173209, caffeinated pepper-type soda): per 100 g, 41 kcal, 10.4 g carbohydrate, 0 g fibre, 10 mg caffeine, 10 mg sodium, 11 mg phosphorus, 3 mg calcium. One 12 fl oz can (368 g) is about 151 kcal, 38.3 g carbohydrate, 37 mg caffeine, 37 mg sodium, 41 mg phosphorus. Diet item (FDC 171876, low-calorie cola-type with sodium saccharin): per 100 g, 0 kcal, 0.1 g carbohydrate, 11 mg caffeine, 16 mg sodium, 11 mg phosphorus. One 12 fl oz can (355 g) is 0 kcal, 0.4 g carbohydrate, 39 mg caffeine, 57 mg sodium, 39 mg phosphorus. Neither supplies protein, fibre or vitamins. USDA lists no total sugars for the regular item, so carbohydrate is stated. This note gives no advice on how much to drink.
1 high certainty1 moderate certainty1 mixed findings4 low certainty2 very low certainty1 not enough evidence
What was looked at
The 10 benefits and uses checked for Soda & Diet Soda, each with how strong the evidence is. Tap one to open it.
- Sugar-sweetened soda and body weight (a risk, not a benefit)Moderate certainty
- Sugar-sweetened soda and type 2 diabetes risk (a risk, not a benefit)Low certainty
- Sugar-sweetened soda and metabolic syndrome (a risk, not a benefit)Low certainty
- Any health benefit of sugar-sweetened sodaNot enough evidence
- Diet soda and weight controlMixed findings
- Diet soda and later diabetes or heart disease (associations)Very low certainty
- Cola and bone density in women (association)Very low certainty
- Soda and kidney stones (association)Low certainty
- Soda and tooth erosion (association)Low certainty
- What a can of soda contains (nutrients)High certainty
Lab markers tracked in the studies
Body weight in adultsBMI in childrenNew type 2 diabetes (incidence)New metabolic syndrome (incidence)Body weight with diet drinks (1-year trial)BMI in sweetener trialsNew type 2 diabetes with artificially sweetened drinksHip bone mineral density in womenNew kidney stonesDental erosion in adolescents
What is Soda & Diet Soda good for?
The main studied questions and how strong the human evidence is for each. Most entries are cautions, not benefits. Almost all of the evidence is observational.
Benefits, one by one
Each card is a research question, not a promise. Tap a goal to filter. Open a card to see the studies, doses and limits.
Sugar-sweetened soda and body weight (a risk, not a benefit)
Moderate certaintyPooled studies link sugar-sweetened drinks, including regular soda, to weight gain. In adult trials, adding these drinks raised body weight by about 0.85 kg on average.
2 studiesSugar-sweetened soft drinks and similar drinks, grouped together in t…
Studies, doses and limits
What the trials found
A 2013 pooled analysis of 32 papers: cohort studies and trials in adults and children. The adult trials were small (5 trials, 292 people in total).
Results
More sugar-sweetened drinks went with more weight gain over time; adding them in trials raised weight; cutting them in trials with children gave a small BMI benefit that was not clearly significant.
Effect sizes as reported
Adult cohorts: 0.22 kg a year per daily serving (random effects; 0.12 kg fixed effects). Adult trials: +0.85 kg (95% CI 0.50 to 1.20). Children cohorts: BMI +0.06 per daily serving. Children trials: BMI gain -0.17 (95% CI -0.39 to 0.05), not significant with random effects.
Why this rating
Moderate because cohorts and trials point the same way, but the adult trials were small and short, the cohort results cannot prove cause, and the abstract gives no GRADE rating. The reviewers concluded these drinks promote weight gain.
Form and dose studied
Sugar-sweetened soft drinks and similar drinks, grouped together in the analysis.
Who was studied
Children and adults in the analysis.
Limits
Not all papers were soda only. Trial details such as length are not in the abstract.
Why researchers looked
Soda adds sugar and calories without fibre or protein, so researchers ask whether it adds to weight gain.
Traditional use
Soda is a manufactured soft drink. Long use as a drink is not proof that it helps any condition.
Proposed mechanism Background
The drinks add energy that the body may not make up for by eating less. This is general background, and was not tested directly in the sources read.
A proposed mechanism does not show that the effect happens in people.
See the Safety tab for sugar and teeth.
Sugar-sweetened soda and type 2 diabetes risk (a risk, not a benefit)
Low certaintyIn studies that followed people over years, those who drank more sugar-sweetened drinks developed type 2 diabetes more often. The link stayed after adjusting for body fat, but studies cannot prove cause.
2 studiesSugar-sweetened drinks as a group (soft drinks, fruit drinks and othe…
Studies, doses and limits
What the trials found
Two pooled analyses of cohort studies: 11 studies in 2010 and 17 cohorts in 2015, in adults without diabetes at the start.
Results
Higher intake went with more new cases of type 2 diabetes and metabolic syndrome. Drinks other than soda were included in these groups.
Effect sizes as reported
2015: +18% per daily serving, or +13% after adjusting for body fat (95% CI 6% to 21%; I2 79%). 2010: relative risk 1.26 (1.12 to 1.41) for type 2 diabetes and 1.20 (1.02 to 1.42) for metabolic syndrome, highest vs lowest intake.
Why this rating
Low because these are observational studies, the studies differed a lot (I2 79% to 89%), the groups included soft drinks other than soda, and cause cannot be shown. The 2015 authors saw no sign of bias for sugar-sweetened drinks.
Form and dose studied
Sugar-sweetened drinks as a group (soft drinks, fruit drinks and others in the 2010 analysis).
Who was studied
Adults without diabetes at the start.
Limits
Questionnaire-based intake; people who drink more soda may differ in other ways.
Why researchers looked
Sugary drinks raise the sugar load quickly, so researchers asked whether regular intake raises diabetes risk.
Traditional use
Soda is a manufactured soft drink. Long use as a drink is not proof that it helps any condition.
Proposed mechanism Observational association
Not established in the sources read. Part of the link may run through weight gain, but the 2015 analysis found it persisted after adjusting for body fat.
A proposed mechanism does not show that the effect happens in people.
Anyone with diabetes should ask their clinician about sugary drinks.
Sugar-sweetened soda and metabolic syndrome (a risk, not a benefit)
Low certaintyA 2010 pooled analysis of three cohort studies linked the highest intake of sugar-sweetened drinks to a higher risk of metabolic syndrome. It is a small, old body of evidence.
1 studiesSugar-sweetened drinks as a group.
Studies, doses and limits
What the trials found
Three prospective cohort studies, 19,431 people and 5,803 cases.
Results
The highest-intake group had a higher risk than the lowest-intake group.
Effect sizes as reported
Relative risk 1.20 (95% CI 1.02 to 1.42).
Why this rating
Low because it is only three observational studies, the interval comes close to 1, and the analysis is from 2010.
Form and dose studied
Sugar-sweetened drinks as a group.
Who was studied
Adults.
Limits
Only three studies; older evidence.
Why researchers looked
Metabolic syndrome is a cluster of conditions (such as high blood sugar and waist size) that raises the risk of heart disease and diabetes.
Traditional use
Soda is a manufactured soft drink. Long use as a drink is not proof that it helps any condition.
Proposed mechanism Observational association
Not established in the sources read.
A proposed mechanism does not show that the effect happens in people.
See Safety.
Any health benefit of sugar-sweetened soda
Not enough evidenceWe read no study showing that drinking regular soda improves a health outcome. Its one nutritional contribution is calories from carbohydrate.
0 studiesNot applicable.
Studies, doses and limits
What the trials found
No trial of soda for health benefit, energy or focus was found in the sources read.
Results
Not enough evidence of benefit.
Why this rating
Insufficient: no study read tested a benefit. This is a gap, not proof that soda has no effect.
Limits
A gap, not evidence of no effect.
Why researchers looked
People drink soda for taste, and for a quick lift from sugar and caffeine.
Traditional use
Soda is a manufactured soft drink. Long use as a drink is not proof that it helps any condition.
Proposed mechanism Background
Sugar provides quick energy and caffeine blocks tiredness signals for a while. This is general background and was not tested in the sources read.
A proposed mechanism does not show that the effect happens in people.
See Safety.
Diet soda and weight control
Mixed findingsThe evidence is mixed. One year-long trial inside a weight-loss program found diet drinks beat water for weight lost. A pooled analysis of seven trials found no significant effect on BMI, and WHO advises against sweeteners for weight control.
5 studiesDiet drinks and other drinks with low- or no-calorie sweeteners; the …
Studies, doses and limits
What the trials found
One randomised trial of 303 adults with overweight or obesity (diet drinks vs water, 1 year, in a weight-loss program); a 2017 pooled analysis of 7 trials (1,003 people, median 6 months); an AHA advisory; and a 2023 WHO guideline.
Results
Mixed. In the trial, 6.21 kg lost with diet drinks vs 2.45 kg with water at 1 year (P < 0.001). In the pooled trials, BMI changed by -0.37 kg/m2 (95% CI -1.10 to 0.36), not significant. The AHA said diet drinks may help adults who drink a lot of sugary drinks to cut calories. WHO recommends against non-sugar sweeteners for weight control because it found no long-term benefit for body fat.
Effect sizes as reported
Trial: 6.21 kg (SD 7.65) vs 2.45 kg (SD 5.59). Pooled trials: BMI -0.37 kg/m2 (-1.10 to 0.36).
Why this rating
Mixed because the best single trial is positive for diet drinks versus water, the pooled trials show no significant BMI effect, cohort studies show a small positive link between sweetener use and BMI, and WHO and the AHA reach different conclusions. WHO's recommendation is conditional and does not apply to people with diabetes.
Form and dose studied
Diet drinks and other drinks with low- or no-calorie sweeteners; the pooled analysis covers sweeteners in foods too.
Who was studied
Adults with overweight or obesity in the trial; mixed adults in the pooled analysis.
Limits
The trial was inside a structured weight-loss program with regular diet drink users, and its abstract does not state funding. The pooled analysis is not specific to soda.
Why researchers looked
Diet soda has no calories, so people use it in place of sugary drinks to cut calories.
Traditional use
Soda is a manufactured soft drink. Long use as a drink is not proof that it helps any condition.
Proposed mechanism Background
Swapping a sugary drink for a zero-calorie one removes calories in the short term. Whether sweeteners change appetite later is unresolved in the sources read.
A proposed mechanism does not show that the effect happens in people.
See Safety for aspartame, phenylketonuria and caffeine.
Diet soda and later diabetes or heart disease (associations)
Very low certaintyStudies that follow people over time link diet drinks to more type 2 diabetes and heart events. The diabetes link shrank a lot after adjusting for body fat, and the authors saw bias, so these studies do not show that diet soda causes disease.
4 studiesArtificially sweetened beverages; sweeteners in general in the 2017 a…
Studies, doses and limits
What the trials found
A 2015 pooled analysis of 17 cohorts for type 2 diabetes; a 2017 pooled analysis of 30 cohort studies for other outcomes; the 2018 AHA advisory; WHO 2023.
Results
Associations only. Artificially sweetened drinks: diabetes +25% per daily serving before adjusting for body fat, +8% (95% CI 2% to 15%) after. Cohort studies of sweeteners also linked use to obesity, high blood pressure, metabolic syndrome, type 2 diabetes and cardiovascular events.
Effect sizes as reported
Diabetes per daily serving: +25% (95% CI 18% to 33%) before and +8% (2% to 15%) after adjustment (I2 70% and 64%).
Why this rating
Very low because these are observational findings with publication bias and residual confounding noted by the authors, possible reverse causation, and because the sweetener analysis covers many foods and drinks, not only soda.
Form and dose studied
Artificially sweetened beverages; sweeteners in general in the 2017 analysis.
Who was studied
Adults and adolescents in cohort studies.
Limits
Cannot show cause either way. No trial of diet soda on diabetes or heart events was read.
Why researchers looked
Because many people switch to diet soda for weight or health reasons, researchers check whether it protects or harms.
Traditional use
Soda is a manufactured soft drink. Long use as a drink is not proof that it helps any condition.
Proposed mechanism Observational association
Not established. A person who already has weight or blood sugar concerns may choose diet soda, which could produce a link that is not caused by the drink (reverse causation).
A proposed mechanism does not show that the effect happens in people.
People with diabetes should ask their clinician about drinks.
Cola and bone density in women (association)
Very low certaintyOne study of older adults found that women who drank cola daily had lower hip bone density. It was seen for diet cola too, and not for men or for other carbonated drinks. It is a single observational study.
1 studiesCola, including diet and decaffeinated cola.
Studies, doses and limits
What the trials found
Framingham Osteoporosis Study: 1,413 women and 1,125 men, bone density at one point in time.
Results
In women, cola intake went with lower bone density at each hip site but not the spine; no link in men. Results were similar for diet cola and weaker for decaffeinated cola. Non-cola carbonated drinks showed no link.
Effect sizes as reported
Daily cola drinkers: femoral neck bone density 3.7% lower, Ward's area 5.4% lower than those drinking under one serving a month.
Why this rating
Very low because it is one cross-sectional study from 2006. The authors asked for more research to confirm it. We read no trial or later pooled analysis.
Form and dose studied
Cola, including diet and decaffeinated cola.
Who was studied
Mostly older adults in one US community study.
Limits
Measured once, and based on a food questionnaire. Cannot show cause.
Why researchers looked
Cola contains caffeine and phosphoric acid, and may displace calcium-rich drinks.
Traditional use
Soda is a manufactured soft drink. Long use as a drink is not proof that it helps any condition.
Proposed mechanism Hypothesis
The authors proposed that caffeine, phosphoric acid or a lower calcium-to-phosphorus ratio could matter. These were not shown to be the cause.
A proposed mechanism does not show that the effect happens in people.
People with osteoporosis can ask their clinician.
Soda and kidney stones (association)
Low certaintyIn three large US cohorts, sugar-sweetened soda went with a higher chance of a first kidney stone. Artificially sweetened non-cola soda showed only a marginal link.
1 studiesSugar-sweetened and artificially sweetened soda, cola and non-cola.
Studies, doses and limits
What the trials found
194,095 people followed for a median of over 8 years; 4,462 first stones.
Results
Sugar-sweetened cola +23% (P for trend 0.02); sugar-sweetened non-cola soda +33% (P for trend 0.003); artificially sweetened non-cola marginal (P for trend 0.05). Coffee, tea, beer, wine and orange juice went with lower risk.
Effect sizes as reported
+23% and +33% as above; no confidence intervals in the abstract.
Why this rating
Low because it is observational and based on questionnaires, though large and long. It does not show that soda causes stones.
Form and dose studied
Sugar-sweetened and artificially sweetened soda, cola and non-cola.
Who was studied
US adults in three cohorts.
Limits
Cannot show cause. The abstract does not separate caffeinated from caffeine-free soda.
Why researchers looked
Drinks are an important part of stone risk because of the fluid they supply and what they contain.
Traditional use
Soda is a manufactured soft drink. Long use as a drink is not proof that it helps any condition.
Proposed mechanism Observational association
Not established in the sources read.
A proposed mechanism does not show that the effect happens in people.
If you have had a kidney stone, ask your clinician about drinks.
Soda and tooth erosion (association)
Low certaintyA 2026 pooled analysis of 24 studies in adolescents found that carbonated drink intake went with about twice the odds of dental erosion. A small lab and mouth study showed a soft drink was the most acidic of the drinks tested.
2 studiesCarbonated drinks (not split into regular and diet in the abstract).
Studies, doses and limits
What the trials found
24 observational studies of adolescents (7,785 in the pooled odds ratio) and one small study of 19 adults.
Results
Dental erosion was common (about 38 in 100 adolescents) and carbonated drink intake went with about double the odds.
Effect sizes as reported
Odds ratio 1.98 (95% CI 1.42 to 2.77; I2 80%); pooled prevalence 37.6% (26.3% to 49.7%).
Why this rating
Low because the studies are observational and differed a lot, the abstract does not say whether the drinks were sugary or diet, and the tooth-pH study measured acidity, not damage.
Form and dose studied
Carbonated drinks (not split into regular and diet in the abstract).
Who was studied
Adolescents; 19 adults in the mouth study.
Limits
Cannot show cause. Adolescents only.
Why researchers looked
Soda is acidic, and teeth are exposed to it with each sip.
Traditional use
Soda is a manufactured soft drink. Long use as a drink is not proof that it helps any condition.
Proposed mechanism Lab and human short term
A lab and in-mouth study found that every drink except water briefly lowered tooth-surface pH, which recovered within 10 to 15 minutes. The authors say this shows acidity, not actual tooth damage.
A proposed mechanism does not show that the effect happens in people.
Ask a dentist about drinks and tooth care.
What a can of soda contains (nutrients)
High certaintyRegular soda is mostly water and carbohydrate. In the USDA item, one 12 fl oz can has about 151 kcal and 38 g of carbohydrate. The diet item has no calories. Neither adds vitamins or fibre.
2 studiesTwo USDA items, as sold.
Studies, doses and limits
What the trials found
USDA FoodData Central items read: a caffeinated pepper-type soda and a low-calorie cola-type soda with sodium saccharin.
Results
The regular item has about 41 kcal and 10.4 g carbohydrate per 100 g; the diet item has 0 kcal and 0.1 g carbohydrate. Both list about 10 to 11 mg of caffeine per 100 g.
Effect sizes as reported
Per 12 fl oz can: regular (368 g) about 151 kcal, 38.3 g carbohydrate, 37 mg caffeine, 37 mg sodium, 41 mg phosphorus; diet (355 g) 0 kcal, 0.4 g carbohydrate, 39 mg caffeine, 57 mg sodium, 39 mg phosphorus.
Why this rating
High that the drinks contain about these amounts (USDA data, an older 2018 release). It does not show any benefit. Modern formulas and brands differ.
Form and dose studied
Two USDA items, as sold.
Who was studied
General diet.
Limits
Nutrient facts, not trials. USDA lists no total sugars for the regular item, so we say carbohydrate.
Why researchers looked
Nutrient values show what the drink supplies.
Traditional use
Soda is a manufactured soft drink. Long use as a drink is not proof that it helps any condition.
Proposed mechanism Nutrient database
These are values from a nutrient table.
A proposed mechanism does not show that the effect happens in people.
Sugar, caffeine and other cautions are on the Safety tab.
Connections to the rest of health
How Soda & Diet Soda connects to the rest of our health knowledge graph. Every link says what kind of connection it is. A safety link (for example to the liver) is a warning, not a benefit. A study that merely mentions a topic never creates a benefit link.
Explore every connection: goals, body systems, organs, symptoms, genes
A. Wellness goals
| Connected to | Kind of connection | Evidence status | Context | Studies |
|---|---|---|---|---|
| Weight Management | Moderate certainty | Sugar-sweetened soda and body weight (a risk, not a benefit): Pooled studies link sugar-sweetened drinks, including regular soda, to weight gain. In adult trials, adding these drinks raised body weight by about 0.85 kg on average. | 8 15 | |
| Blood Sugar Balance | Low certainty | Sugar-sweetened soda and type 2 diabetes risk (a risk, not a benefit): In studies that followed people over years, those who drank more sugar-sweetened drinks developed type 2 diabetes more often. The link stayed after adjusting for body fat, but studies cannot prove cause. Diet soda and later diabetes or heart disease (associations): Studies that follow people over time link diet drinks to more type 2 diabetes and heart events. The diabetes link shrank a lot after adjusting for body fat, and the authors saw bias, so these studies do not show that diet soda causes disease. | 4 7 1 5 18 | |
| Metabolic Health | Low certainty | Sugar-sweetened soda and type 2 diabetes risk (a risk, not a benefit): In studies that followed people over years, those who drank more sugar-sweetened drinks developed type 2 diabetes more often. The link stayed after adjusting for body fat, but studies cannot prove cause. Sugar-sweetened soda and metabolic syndrome (a risk, not a benefit): A 2010 pooled analysis of three cohort studies linked the highest intake of sugar-sweetened drinks to a higher risk of metabolic syndrome. It is a small, old body of evidence. | 4 7 | |
| Energy Boost | Not enough evidence | Any health benefit of sugar-sweetened soda: We read no study showing that drinking regular soda improves a health outcome. Its one nutritional contribution is calories from carbohydrate. | ||
| Weight Management | Mixed findings | Diet soda and weight control: The evidence is mixed. One year-long trial inside a weight-loss program found diet drinks beat water for weight lost. A pooled analysis of seven trials found no significant effect on BMI, and WHO advises against sweeteners for weight control. | 9 1 5 18 14 | |
| Heart Health | Very low certainty | Diet soda and later diabetes or heart disease (associations): Studies that follow people over time link diet drinks to more type 2 diabetes and heart events. The diabetes link shrank a lot after adjusting for body fat, and the authors saw bias, so these studies do not show that diet soda causes disease. | 4 1 5 18 | |
| Bone Health | Very low certainty | Cola and bone density in women (association): One study of older adults found that women who drank cola daily had lower hip bone density. It was seen for diet cola too, and not for men or for other carbonated drinks. It is a single observational study. | 10 | |
| Kidney Health | Low certainty | Soda and kidney stones (association): In three large US cohorts, sugar-sweetened soda went with a higher chance of a first kidney stone. Artificially sweetened non-cola soda showed only a marginal link. | 2 | |
| Healthy Teeth | Low certainty | Soda and tooth erosion (association): A 2026 pooled analysis of 24 studies in adolescents found that carbonated drink intake went with about twice the odds of dental erosion. A small lab and mouth study showed a soft drink was the most acidic of the drinks tested. | 6 3 | |
| Weight Management | High certainty | What a can of soda contains (nutrients): Regular soda is mostly water and carbohydrate. In the USDA item, one 12 fl oz can has about 151 kcal and 38 g of carbohydrate. The diet item has no calories. Neither adds vitamins or fibre. | 15 14 |
B. Body systems
| Connected to | Kind of connection | Evidence status | Context | Studies |
|---|---|---|---|---|
| Metabolism Weight | Biological association | Moderate certainty | Studied for: Sugar-sweetened soda and body weight (a risk, not a benefit) Studied for: Sugar-sweetened soda and type 2 diabetes risk (a risk, not a benefit) | 8 15 4 7 9 1 5 18 14 |
| Blood Sugar Support | Biological association | Low certainty | Studied for: Sugar-sweetened soda and type 2 diabetes risk (a risk, not a benefit) Studied for: Diet soda and later diabetes or heart disease (associations) | 4 7 1 5 18 |
| Bones Joints Muscles | Biological association | Very low certainty | Studied for: Cola and bone density in women (association) | 10 |
| Kidney Urinary | Biological association | Low certainty | Studied for: Soda and kidney stones (association) | 2 |
| Digestive System | Biological association | Low certainty | Studied for: Soda and tooth erosion (association) | 6 3 |
E. Health conditions
| Connected to | Kind of connection | Evidence status | Context | Studies |
|---|---|---|---|---|
| Type 2 diabetes | Adverse effect or risk | Preliminary mixed | Higher incidence with more sugar-sweetened drinks in cohort studies. More new cases with more sugar-sweetened drinks in cohort studies. Preparation or compound: Sugar-sweetened soda |
4 7 |
| Weight gain | Adverse effect or risk | Documented risk | Adult trials: +0.85 kg when sugar-sweetened drinks were added. Preparation or compound: Sugar-sweetened soda |
8 |
| Phenylketonuria | Contraindication | Documented risk | People with PKU should avoid or restrict aspartame. Preparation or compound: Aspartame in diet soda |
11 |
| Kidney stones | Adverse effect or risk | Preliminary mixed | Higher stone risk in three US cohorts. Preparation or compound: Sugar-sweetened soda |
2 |
I. Biomarkers
| Connected to | Kind of connection | Evidence status | Context | Studies |
|---|---|---|---|---|
| Body weight in adults | Biological association | Moderate certainty | Measured in trials: raised when sugar-sweetened drinks were added. A lab change is not the same as a health benefit. | 8 |
| BMI in children | Biological association | Low certainty | Measured in trials: small difference, not clearly significant in trials. A lab change is not the same as a health benefit. | 8 |
| New type 2 diabetes (incidence) | Biological association | Low certainty | Measured in trials: higher with more sugar-sweetened drinks. A lab change is not the same as a health benefit. | 4 7 |
| New metabolic syndrome (incidence) | Biological association | Low certainty | Measured in trials: higher with more sugar-sweetened drinks. A lab change is not the same as a health benefit. | 7 |
| Body weight with diet drinks (1-year trial) | Biological association | Low certainty | Measured in trials: more weight lost with diet drinks than with water. A lab change is not the same as a health benefit. | 9 |
| BMI in sweetener trials | Biological association | Low certainty | Measured in trials: no significant change. A lab change is not the same as a health benefit. | 1 |
| New type 2 diabetes with artificially sweetened drinks | Biological association | Very low certainty | Measured in trials: higher before adjustment, much smaller after adjusting for body fat. A lab change is not the same as a health benefit. | 4 |
| Hip bone mineral density in women | Biological association | Very low certainty | Measured in trials: lower in daily cola drinkers. A lab change is not the same as a health benefit. | 10 |
| New kidney stones | Biological association | Low certainty | Measured in trials: higher with sugar-sweetened soda. A lab change is not the same as a health benefit. | 2 |
| Dental erosion in adolescents | Biological association | Low certainty | Measured in trials: about twice the odds with carbonated drinks. A lab change is not the same as a health benefit. | 6 |
K. Biological pathways
| Connected to | Kind of connection | Evidence status | Context | Studies |
|---|---|---|---|---|
| Caffeine | Preliminary mechanism | Human | About 37 to 39 mg per 12 fl oz can in the two USDA items. | 15 14 |
| Phenylalanine | Preliminary mechanism | Human | Aspartame is a source; PKU label statement is required (FDA). | 11 |
| Phosphorus | Preliminary mechanism | Human | 11 mg per 100 g in both USDA items. | 15 14 |
L. Active compounds
| Connected to | Kind of connection | Evidence status | Context | Studies |
|---|---|---|---|---|
| Sugars and other carbohydrate | Biological association | Human | Supplies energy. The regular item has about 41 kcal per 100 g. Preparation or compound: Added in manufacture (type of sweetener not stated in the USDA item) |
15 |
| Caffeine | Biological association | Human | A stimulant. The FDA lists its signs when taken in excess. Many, but not all, sodas contain it. Preparation or compound: Added or from flavourings (not stated in the sources read) |
15 14 12 |
| Non-sugar sweeteners (aspartame, saccharin and others) | Biological association | Human | Give sweetness without calories. Aspartame is a source of phenylalanine (see Safety). Preparation or compound: Added in manufacture |
14 16 11 |
| Phosphorus (phosphoric acid in colas) | Biological association | Human | Contributes acidity. Not shown to harm bones in the abstract read. Preparation or compound: Added in manufacture |
15 14 10 |
Each connection is stored with the ingredient, the connected record, the kind of connection, the evidence status, the supporting studies, the preparation or compound involved, and a review date (last reviewed October 26, 2026).
Evidence at a glance: what the research found for 10 outcomes
Each outcome below is one thing researchers measured. Certainty is how far the evidence can be trusted, not how well it works. The full studies are on the next tab.
The evidence
The research centre for Soda & Diet Soda. Every record here was checked against PubMed or the publisher's page; we never list a study we have not verified.
Evidence by outcome
Bars show how many studies we found for each outcome, not how well it works. People are added up across trials only (reviews are not added, to avoid double counting).
How we rate evidence
High certainty
Several well-run trials or reviews agree; further research is unlikely to change the picture much.
Moderate certainty
Good trials point the same way, but some doubt remains.
Low certainty
Small, short or inconsistent trials. The finding could change with better research.
Very low certainty
Very little or very weak human data. Treat as a possibility only.
Mixed findings
Trials or reviews disagree with each other.
Not enough evidence
Not enough human research to say either way.
Evidence against
Good research found no benefit, or found harm.
We take the reviewers' own risk-of-bias and GRADE statements where they exist, and otherwise judge from study size, design, consistency, directness and whether a product matches what is sold. Many publications do not make evidence high. Method note: We started from our existing soda and diet soda summary, re-checked nutrition against saved USDA FoodData Central data, read the FDA, WHO and NHS pages and re-read PubMed abstracts for 10 papers. Only abstracts were read for studies. Items we could not verify are flagged in the research gaps.
Study library: every study we checked 18
| Study | Design | People | Product, dose, length | Result |
|---|---|---|---|---|
| Azad 2017 Nonnutritive sweeteners and cardiometabolic health: a systematic review and meta-analysis of randomized controlled trials and prospective cohort studies. CMAJ · PMID 28716847 · DOI |
Systematic review meta analysis |
7 trials (1,003 people, median follow-up 6 months) and 30 cohort studies (405,907 people, median follow-up 10 years) | Non-nutritive (low- or no-calorie) sweeteners such as aspartame, sucralose and stevioside, in drinks and foods Drink as sold Varied Trials median 6 months; cohorts median 10 years · vs Sugar or no sweetener |
In the trials, the sweeteners had no significant effect on BMI. In the cohort studies, use went with a small rise in BMI and with higher rates of obesity, high blood pressure, metabolic syndrome, type 2 diabetes and cardiovascular events. Publication bias was seen for diabetes. The authors said trial evidence does not clearly support weight-control benefits. Trials: BMI mean difference -0.37 kg/m2, not significant. Cohorts: BMI correlation 0.05 (Trials -1.10 to 0.36; cohorts 0.03 to 0.06) Methods, limits and fundingOutcomes: BMI first; also weight, waist, obesity, blood pressure, diabetes and cardiovascular events Limitations: Covers sweeteners in all foods and drinks, not only soda. Trials were few and small (242 people for the BMI result). Cohort links may reflect people with weight problems choosing diet products. Funding and conflicts: One author reported speaker fees from Medtronic; no other competing interests were declared. Registration: PROSPERO CRD42015019749 Read: abstract |
| Ferraro 2013 Soda and other beverages and the risk of kidney stones. Clin J Am Soc Nephrol · PMID 23676355 · DOI |
Prospective cohort |
194095 194,095 people in three large US cohorts, followed a median of more than 8 years; 4,462 first kidney stones |
Sugar-sweetened and artificially sweetened soda, cola and non-cola Drink as sold Highest vs lowest category of intake Median follow-up over 8 years · vs Lowest intake category |
Sugar-sweetened cola and sugar-sweetened non-cola soda went with a higher stone risk. Artificially sweetened non-cola soda showed a marginal link. Coffee, tea, beer, wine and orange juice went with lower stone risk. Sugar-sweetened cola +23% (P for trend 0.02); sugar-sweetened non-cola +33% (P for trend 0.003); artificially sweetened non-cola marginal (P for trend 0.05) (Not given in the abstract) Methods, limits and fundingOutcomes: New kidney stones Limitations: Questionnaire-based and observational, so it cannot prove cause. Funding and conflicts: Funding is not stated in the abstract (US NIH extramural support is listed as a publication type). Read: abstract |
| Guazzo 2026 An In Vitro and In Vivo Assessment of Acidogenicity of Several Alcoholic and Non-Alcoholic Beverages. Clin Exp Dent Res · PMID 42830648 · DOI |
Lab and small human study |
19 19 healthy adults held 10 mL of each drink in the mouth for 1 minute; lab acidity tests of eight drinks including one non-alcoholic soft drink |
One non-alcoholic soft drink (brand and sugar content not given in the abstract), among wines, beer and orange juice Drink as sold 10 mL held in the mouth for 1 minute Tooth-surface pH recorded for up to 30 minutes · vs Water |
In the lab, the soft drink had the lowest starting pH of the drinks tested. In people, every drink except water briefly lowered tooth-surface pH, which recovered toward normal within 10 to 15 minutes. Drinks with high titratable acidity (traditional-method sparkling wine and orange juice) gave a longer acid challenge. The authors say this shows acidity, not tooth damage. Lowest mean tooth-surface pH was 6.2 (traditional-method sparkling wine); no value for the soft drink is given in the abstract (Not given in the abstract) Methods, limits and fundingOutcomes: Lab acidity and tooth-surface pH Limitations: Only one unnamed soft drink; short-term pH only, not tooth loss. Small sample. Funding and conflicts: The authors declare no conflicts of interest. Read: abstract |
| Imamura 2015 Consumption of sugar sweetened beverages, artificially sweetened beverages, and fruit juice and incidence of type 2 diabetes: systematic review, meta-analysis, and estimation of population attributable fraction. BMJ · PMID 26199070 · DOI |
Systematic review meta analysis |
17 cohorts (38,253 cases over 10,126,754 person-years) in adults without diabetes, searched to February 2014 | Sugar-sweetened and artificially sweetened beverages, and fruit juice Drink as sold Per one serving a day Follow-up of years · vs Lower or no intake |
More sugar-sweetened drinks went with more new type 2 diabetes, and the link stayed after adjusting for body fat. Artificially sweetened drinks went with more diabetes before adjustment, but the link was much smaller after adjustment, and the authors saw publication bias and residual confounding. Neither was judged a healthy alternative. Sugar-sweetened: +18% per serving a day before and +13% after adjusting for body fat (I2 89% and 79%). Artificially sweetened: +25% before and +8% after adjustment (I2 70% and 64%). Fruit juice: +5% (not significant) and +7% (Sugar-sweetened 9% to 28% before and 6% to 21% after; artificially sweetened 18% to 33% and 2% to 15%) Methods, limits and fundingOutcomes: Incidence of type 2 diabetes, before and after adjusting for body fat Limitations: Observational; high differences between studies (I2 up to 89%). The authors' estimates of cases due to these drinks assume cause, which is not proven. Funding and conflicts: The authors declared no support from any organisation for the submitted work and no relevant financial relationships. Read: abstract |
| Johnson 2018 Low-Calorie Sweetened Beverages and Cardiometabolic Health: A Science Advisory From the American Heart Association. Circulation · PMID 30354445 · DOI |
Science advisory |
Review of observational studies and clinical trials, with the positions of government agencies | Low-calorie sweetened beverages (diet drinks) Drink as sold · vs Sugar-sweetened beverages or water |
The writing group said diet drinks may be an effective way to help control energy intake and promote weight loss, but there is little evidence on possible harms. For adults who drink a lot of sugar-sweetened drinks, diet drinks may be a useful replacement. It was judged prudent to advise against prolonged use of these drinks by children. Water, plain or carbonated or unsweetened flavored, was the preferred choice. Not applicable (Not applicable) Methods, limits and fundingOutcomes: Energy intake, weight and cardiometabolic health Limitations: A 2018 advisory, not a trial. It does not tell the sweeteners apart. It says evidence on harms is thin. Funding and conflicts: Written by an American Heart Association committee; the abstract lists no funders. Read: abstract |
| Juárez López 2026 Prevalence and Risk of Dental Erosion Linked to Carbonated Drinks in Adolescents: A Systematic Review and Meta-Analysis. Oral Health Prev Dent · PMID 42113589 · DOI |
Systematic review meta analysis |
21541 24 observational studies, 21,541 adolescents (7,785 in the pooled odds ratio) |
Carbonated beverages (soft drinks) Drink as sold Intake vs no or lower intake Observational · vs Lower or no intake |
Dental erosion was common in the adolescents studied (about 38 in 100), and carbonated drink intake went with about twice the odds of erosion. Pooled prevalence 37.6%; odds ratio 1.98 (Prevalence 26.3% to 49.7%; odds ratio 1.42 to 2.77) Methods, limits and fundingOutcomes: Dental erosion Limitations: Observational and the results differed a lot between studies (I2 80%). The abstract does not say whether drinks were sugary or diet. Adolescents only. Funding and conflicts: The authors declare no conflict of interest. Read: abstract |
| Malik 2010 Sugar-sweetened beverages and risk of metabolic syndrome and type 2 diabetes: a meta-analysis. Diabetes Care · PMID 20693348 · DOI |
Systematic review meta analysis |
11 prospective cohort studies searched to May 2010 (3 for metabolic syndrome, 19,431 people and 5,803 cases; 8 for type 2 diabetes, 310,819 people and 15,043 cases) | Sugar-sweetened beverages (soft drinks, fruit drinks, iced tea, energy and vitamin water drinks) Drink as sold Highest vs lowest intake group (most often 1 to 2 servings a day vs none or under 1 a month) Cohort follow-up · vs Lowest intake group |
The highest-intake group had a higher risk of both type 2 diabetes and metabolic syndrome than the lowest-intake group. Type 2 diabetes relative risk 1.26; metabolic syndrome relative risk 1.20 (Diabetes 1.12 to 1.41; metabolic syndrome 1.02 to 1.42) Methods, limits and fundingOutcomes: Metabolic syndrome and type 2 diabetes Limitations: Observational. Includes drinks other than soda. An older analysis (searched to 2010). Funding and conflicts: Funding is not stated in the abstract. Read: abstract |
| Malik 2013 Sugar-sweetened beverages and weight gain in children and adults: a systematic review and meta-analysis. Am J Clin Nutr · PMID 23966427 · DOI |
Systematic review meta analysis |
32 articles searched to March 2013: 20 in children (15 cohort studies, n = 25,745; 5 trials, n = 2,772) and 12 in adults (7 cohort studies, n = 174,252; 5 trials, n = 292) | Sugar-sweetened beverages (soft drinks and others) Drink as sold Varied; cohort results are per one daily serving Cohorts followed for 1 year or more; trials varied · vs Less or no sugar-sweetened drink |
In cohort studies, each extra daily serving went with a small yearly weight gain in adults and a small BMI rise in children. In adult trials, adding sugar-sweetened drinks raised body weight. In children, trials that cut these drinks showed a small, not clearly significant, smaller BMI gain with random-effects models. The authors concluded these drinks promote weight gain in children and adults. Adults, cohorts: 0.22 kg per serving per year (random effects) and 0.12 kg (fixed effects). Adult trials: +0.85 kg when added. Children, cohorts: BMI +0.06 and +0.05 units per serving. Children, trials: BMI gain -0.17 (random effects, not significant) and -0.12 (fixed effects) (Adults cohorts 0.09 to 0.34 kg (random); adult trials 0.50 to 1.20 kg; children trials -0.39 to 0.05 (random)) Methods, limits and fundingOutcomes: Body weight in adults, BMI in children Limitations: The adult trials were small (292 people in total). Cohort studies cannot prove cause. The abstract does not describe how long the trials lasted. Funding and conflicts: Funding is not stated in the abstract (the abstract lists no competing interests). Read: abstract |
| Peters 2016 The effects of water and non-nutritive sweetened beverages on weight loss and weight maintenance: A randomized clinical trial. Obesity (Silver Spring) · PMID 26708700 · DOI |
Randomised controlled trial |
303 303 weight-stable adults with overweight or obesity, most of them regular users of diet drinks, in a one-year behavioural weight-loss program |
Beverages sweetened with non-nutritive sweeteners (diet drinks) Drink as sold 24 ounces (710 ml) a day 1 year · vs Water |
The two groups were not equivalent: the diet-drink group lost more weight. The authors concluded diet drinks can be a useful tool within a weight-management program. Weight lost at 1 year: 6.21 kg (SD 7.65) with diet drinks vs 2.45 kg (SD 5.59) with water (P < 0.001) (Not given in the abstract) Methods, limits and fundingOutcomes: Body weight change at 1 year Limitations: One trial, inside a structured weight-loss program, in people who were already regular diet drink users. It tests diet drinks against water, not against sugary soda. It cannot speak to long-term health effects of the sweeteners. Funding and conflicts: Funding is not stated in the abstract; some authors work at Weight Watchers (listed in the author affiliations). Read: abstract |
| Tucker 2006 Colas, but not other carbonated beverages, are associated with low bone mineral density in older women: The Framingham Osteoporosis Study. Am J Clin Nutr · PMID 17023723 · DOI |
Cross sectional cohort |
2538 1,413 women and 1,125 men in the Framingham Osteoporosis Study, bone density by DXA, intake by food-frequency questionnaire |
Cola and other carbonated soft drinks Drink as sold Frequency of drinking (daily vs less than once a month) Single time point (cross-sectional) · vs Less than 1 serving of cola a month |
In women, but not men, cola intake went with lower bone density at each hip site but not the spine. Results were similar for diet cola and weaker for decaffeinated cola. Other carbonated drinks showed no link. Calcium-to-phosphorus ratios were lower in daily cola drinkers. Daily cola drinkers: femoral neck bone density 3.7% lower and Ward's area 5.4% lower than those drinking under 1 serving a month (Not given in the abstract) Methods, limits and fundingOutcomes: Bone mineral density at the spine and three hip sites Limitations: Observational and measured once, so it cannot show cause. The authors asked for more research to confirm. Published in 2006. Funding and conflicts: Funding is not stated in the abstract (US NIH extramural support is listed as a publication type). Read: abstract |
| s-fda-aspartame Aspartame and Other Sweeteners in Food (US FDA) · Source |
Regulator n/a |
Methods, limits and fundingRead: full-text | ||
| s-fda-caffeine Spilling the Beans: How Much Caffeine is Too Much? (US FDA) · Source |
Regulator n/a |
Methods, limits and fundingRead: full-text | ||
| s-nhs-foods-to-avoid Foods to avoid in pregnancy: caffeine (NHS) · Source |
Regulator n/a |
Methods, limits and fundingRead: full-text | ||
| s-usda-fdc-171876 USDA FoodData Central: low-calorie carbonated beverage, cola or pepper-types, with sodium saccharin, contains caffeine (SR Legacy, FDC 171876) · Source |
Database n/a |
Methods, limits and fundingRead: full-text | ||
| s-usda-fdc-173209 USDA FoodData Central: carbonated beverage, pepper-type, contains caffeine (SR Legacy, FDC 173209) · Source |
Database n/a |
Methods, limits and fundingRead: full-text | ||
| s-who-aspartame Aspartame hazard and risk assessment results released (IARC and JECFA) · Source |
Regulator n/a |
Methods, limits and fundingRead: full-text | ||
| s-who-healthy-diet Healthy diet (WHO fact sheet) · Source |
Guideline n/a |
Methods, limits and fundingRead: full-text | ||
| s-who-nss WHO advises not to use non-sugar sweeteners for weight control in newly released guideline · Source |
Guideline n/a |
Methods, limits and fundingRead: full-text |
What we do not know yet
- No trial of regular soda on blood sugar, blood pressure or cholesterol was read.
- Most studies group soda with other sugar-sweetened or sweetened drinks, so soda alone is hard to separate.
- No trial of diet soda on diabetes or heart disease was read.
- Individual sweeteners other than aspartame and saccharin were not read.
- Contamination, allergy to additives and caffeine-free soda were not researched.
- The CDC sugary-drink page could not be read, so it is not used.
How new research is added
New studies are found by a saved PubMed search and placed in a review queue before the page changes.
Lab markers
What changed in blood or saliva tests during trials. A changed number is not the same as feeling or being healthier, and we give no "normal ranges".
Metabolic 1
Body weight in adults
Raised when sugar-sweetened drinks were added in trials
How heavy a person is, measured in kilograms.
Moderate certaintyResults and what it means
Why it was measured
It is the usual outcome when testing whether sugary drinks add to weight gain.
Statistical vs. clinical meaning
The trials were small, but the direction matches the cohort studies. It is a caution, not a benefit.
Safety implication
See the Safety tab.
| Study | Result | People | Product |
|---|---|---|---|
| 8 | Weight rose by 0.85 kg (95% CI 0.50 to 1.20) when sugar-sweetened drinks were added in 5 adult trials | 5 trials, 292 adults in total | Added sugar-sweetened drinks |
| 8 | In cohorts, each extra daily serving went with 0.22 kg (95% CI 0.09 to 0.34; random effects) more weight over one year | 7 cohort studies, 174,252 adults | One more daily serving of sugar-sweetened drink |
Other 9
BMI in children
Small difference, not clearly significant in trials in trials
Body mass index: weight in relation to height.
Low certaintyResults and what it means
Why it was measured
It is the usual measure of weight gain in children.
Statistical vs. clinical meaning
The cohort link is small and the trial result is not clearly significant. The reviewers found larger effects in drink-substitution trials and in children with overweight.
Safety implication
Ask a paediatrician about drinks for children.
| Study | Result | People | Product |
|---|---|---|---|
| 8 | In cohorts, BMI rose by 0.06 units (95% CI 0.02 to 0.10) per daily serving; in 5 trials that cut these drinks, BMI gain was 0.17 lower (95% CI -0.39 to 0.05), not significant with random effects | 15 cohort studies (n = 25,745) and 5 trials (n = 2,772) in children | Sugar-sweetened drinks |
New type 2 diabetes (incidence)
Higher with more sugar-sweetened drinks in trials
How many people in a group are newly diagnosed with type 2 diabetes over time.
Low certaintyResults and what it means
Why it was measured
Cohort studies track who develops diabetes by how much they drink.
Statistical vs. clinical meaning
Observational, with large differences between studies. A caution, not a benefit.
Safety implication
People with diabetes or prediabetes should ask their clinician.
| Study | Result | People | Product |
|---|---|---|---|
| 4 | +18% per daily serving (95% CI 9% to 28%), or +13% (6% to 21%) after adjusting for body fat | 17 cohorts, 38,253 cases | Sugar-sweetened beverages, per serving a day |
| 7 | Relative risk 1.26 (1.12 to 1.41), highest vs lowest intake | 8 cohort studies, 310,819 people, 15,043 cases | Sugar-sweetened beverages |
New metabolic syndrome (incidence)
Higher with more sugar-sweetened drinks in trials
A cluster of conditions (such as high blood sugar and a large waist) that raises the risk of diabetes and heart disease.
Low certaintyResults and what it means
Why it was measured
It is a combined measure of metabolic health.
Statistical vs. clinical meaning
Only three studies, and an old analysis.
Safety implication
See Safety.
| Study | Result | People | Product |
|---|---|---|---|
| 7 | Relative risk 1.20 (1.02 to 1.42), highest vs lowest intake | 3 cohort studies, 19,431 people, 5,803 cases | Sugar-sweetened beverages |
Body weight with diet drinks (1-year trial)
More weight lost with diet drinks than with water in trials
Weight lost, in kilograms, after one year.
Low certaintyResults and what it means
Why it was measured
It is the main measure used when asking whether diet drinks help weight control.
Statistical vs. clinical meaning
One trial in a special setting. Pooled trials found no significant BMI effect.
Safety implication
WHO advises against sweeteners for weight control; see Safety.
| Study | Result | People | Product |
|---|---|---|---|
| 9 | 6.21 kg lost (SD 7.65) with diet drinks vs 2.45 kg (SD 5.59) with water at 1 year (P < 0.001) | 303 adults with overweight or obesity in a behavioural weight-loss program | Diet drinks vs water, 24 oz (710 ml) a day |
BMI in sweetener trials
No significant change in trials
Body mass index: weight in relation to height.
Low certaintyResults and what it means
Why it was measured
The primary outcome of the 2017 pooled analysis.
Statistical vs. clinical meaning
Few and small trials.
Safety implication
See Safety.
| Study | Result | People | Product |
|---|---|---|---|
| 1 | Mean difference -0.37 kg/m2 (95% CI -1.10 to 0.36), not significant | Trials of sweeteners, 242 participants for this result | Non-nutritive sweeteners |
New type 2 diabetes with artificially sweetened drinks
Higher before adjustment, much smaller after adjusting for body fat in trials
How many people newly develop type 2 diabetes.
Very low certaintyResults and what it means
Why it was measured
Cohort studies track diabetes by diet drink intake.
Statistical vs. clinical meaning
Observational, with bias flagged. Not proof of harm.
Safety implication
People with diabetes should ask their clinician.
| Study | Result | People | Product |
|---|---|---|---|
| 4 | +25% (18% to 33%) per serving a day before and +8% (2% to 15%) after adjusting for body fat; publication bias and residual confounding were indicated | 17 cohorts, 38,253 cases (all drinks) | Artificially sweetened beverages |
Hip bone mineral density in women
Lower in daily cola drinkers in trials
How dense the bones are, measured by a scan (DXA).
Very low certaintyResults and what it means
Why it was measured
Lower density means weaker bones.
Statistical vs. clinical meaning
One cross-sectional study; not seen in men or for other carbonated drinks.
Safety implication
See Safety.
| Study | Result | People | Product |
|---|---|---|---|
| 10 | Femoral neck 3.7% lower and Ward's area 5.4% lower in women drinking cola daily vs under once a month | 1,413 women in the Framingham Osteoporosis Study | Cola (regular, diet and decaffeinated) |
New kidney stones
Higher with sugar-sweetened soda in trials
How many people develop a first kidney stone.
Low certaintyResults and what it means
Why it was measured
Cohort studies track stones by drink type.
Statistical vs. clinical meaning
Observational but large.
Safety implication
See Safety.
| Study | Result | People | Product |
|---|---|---|---|
| 2 | +23% for sugar-sweetened cola and +33% for sugar-sweetened non-cola soda, highest vs lowest category | 194,095 people, 4,462 first stones | Sugar-sweetened soda |
Dental erosion in adolescents
About twice the odds with carbonated drinks in trials
Loss of tooth surface from acid, not from decay.
Low certaintyResults and what it means
Why it was measured
It is the tooth outcome studied for carbonated drinks.
Statistical vs. clinical meaning
Observational, large differences between studies.
Safety implication
See Safety.
| Study | Result | People | Product |
|---|---|---|---|
| 6 | Odds ratio 1.98 (95% CI 1.42 to 2.77); pooled prevalence 37.6% | 24 studies; 21,541 adolescents | Carbonated beverage consumption |
Safety
What studies and official sources say about side effects, medicines and who should check first. Each point shows what kind of evidence it comes from.
Main points to know 7
- Sugar, weight and teeth (regular soda). WHO says free sugars should be limited to less than 10% of daily energy, and that 5% or less may give extra benefit. In the USDA regular soda item, one 12 fl oz can has about 38 g of carbohydrate and about 151 kcal. Pooled studies link sugar-sweetened drinks to weight gain and to a higher chance of type 2 diabetes, and carbonated drinks to dental erosion in adolescents. These are mostly observational findings. Guideline and reviews 17 15 8 4 6
- Caffeine in many sodas. The USDA items read have about 37 mg (regular) and 39 mg (diet) of caffeine in a 12 fl oz can. The FDA lists 23 to 83 mg in 12 fl oz of caffeinated soft drink, and has cited about 400 mg a day from all sources as an amount not generally linked to negative effects in most healthy adults, with wide differences in sensitivity. Many sodas are caffeine-free; the label says. Authoritative guidance 12 15 14
- Pregnancy and breastfeeding. The NHS says not to have more than 200 mg of caffeine a day in pregnancy, and estimates 40 mg in a can of cola. It says too much caffeine has been linked to a higher chance of miscarriage and stillbirth. The FDA says to talk to a health care provider about limiting caffeine if you are pregnant, trying to become pregnant or breastfeeding. We did not read pregnancy guidance on sweeteners in soda. Authoritative guidance 13 12
- Children and teens. The FDA, citing the Dietary Guidelines, says drinks with caffeine should be avoided for children under 2 and drinks with no added sugars should be the first choice for children and teens. The American Heart Association writing group said it is prudent to advise against prolonged use of diet drinks by children, and that water is the best choice; children with diabetes might use diet drinks in place of sugary ones when needed, with close glucose monitoring. Authoritative guidance 12 5
- Phenylketonuria (PKU) and aspartame. People with the rare inherited condition phenylketonuria should avoid or restrict aspartame, a common diet soda sweetener. The FDA says labels must state that the product contains phenylalanine. Authoritative guidance 11
- Aspartame and cancer: what the agencies said. In 2023 IARC classified aspartame as possibly carcinogenic to humans (Group 2B) on limited evidence, mainly for liver cancer in humans. The joint WHO/FAO committee (JECFA) kept its acceptable daily intake at 40 mg per kg of body weight and found the evidence of a cancer link in humans not convincing. The FDA disagrees with IARC's conclusion and has no safety concerns at approved use. Group 2B reflects strength of evidence, not level of risk. Authoritative guidance 16 11
- People with diabetes. WHO's advice against sweeteners for weight control does not apply to people with pre-existing diabetes. Sugar-sweetened drinks went with more new type 2 diabetes in cohort studies. We did not read a trial of how soda affects blood sugar after a drink, so ask your clinician about drinks if you have diabetes or take diabetes medicine. Authoritative guidance 18 4
Side effects 6
| Effect | How often | Severity and recovery | Evidence |
|---|---|---|---|
| Weight gain with sugar-sweetened soda Sugar-sweetened drinks as a group; small adult trials. | Adult trials: +0.85 kg when sugar-sweetened drinks were added (95% CI 0.50 to 1.20). Adult cohorts: 0.22 kg a year per daily serving (random effects) | mild to moderate; cumulative Not studied beyond the trials | Systematic review of trials and cohorts 8 |
| Higher chance of type 2 diabetes with sugar-sweetened drinks Association, not proof of cause. Large differences between studies. | +13% per daily serving after adjusting for body fat (95% CI 6% to 21%) | serious if it develops Not applicable | Observational cohorts 4 7 |
| Dental erosion A small study found tooth-surface pH fell briefly after a soft drink and recovered in 10 to 15 minutes. | Odds ratio 1.98 (95% CI 1.42 to 2.77) for carbonated drinks in adolescents | mild to moderate Lost tooth surface does not grow back | Observational meta analysis 6 3 |
| Kidney stones with sugar-sweetened soda Questionnaire-based. Artificially sweetened non-cola soda showed a marginal link. | +23% (cola) and +33% (non-cola) in the highest intake groups | moderate (painful) Not applicable | Observational cohorts 2 |
| Lower hip bone density in women who drink cola daily One 2006 study; also seen for diet cola; not in men. | Femoral neck 3.7% lower, Ward's area 5.4% lower | unknown clinical impact Not studied | Observational cross sectional 10 |
| Too much caffeine: fast heartbeat, palpitations, high blood pressure, insomnia, anxiety, jitters, upset stomach, nausea, headache The FDA says people differ widely in sensitivity. Caffeine withdrawal is not considered dangerous but can be unpleasant. | Varies with sensitivity | mild to moderate Usually passes as caffeine clears | Authoritative guidance 12 |
Liver
No liver injury from soda was found in the sources read. IARC's aspartame review mentions limited evidence for liver cancer in humans, which is a cancer-hazard classification, not a report of liver injury. 16
How often. No frequency was found.
Monitoring. No agency monitoring advice was found.
This is a safety connection. It is not evidence that Soda & Diet Soda supports liver health.
Medicines and supplements 3
| With | Why it matters | Importance | Evidence | What to do |
|---|---|---|---|---|
| Medicines and conditions that raise caffeine sensitivity drug-and-condition | The FDA says some medicines and conditions make people more sensitive to caffeine, without naming them in the page we read. | Not specified by the FDA page. | Authoritative guidance Not enough evidence 12 | Ask your doctor or pharmacist whether caffeine in soda matters for your medicines. |
| Diabetes medicines (insulin, tablets) drug | Not researched. Regular soda adds sugar; diet soda adds almost none. | Not researched. | None found Not enough evidence | Ask your doctor or pharmacist how sugary drinks fit with your diabetes plan. |
| Phenylalanine-restricted diets (phenylketonuria) condition | Aspartame is a source of phenylalanine, according to the FDA label rule. | People with PKU should avoid or restrict aspartame. | Authoritative guidance High certainty 11 | Read the label for the phenylalanine statement and ask your metabolic clinic. |
Who should check first 5
| Situation | Advice | Evidence |
|---|---|---|
| Phenylketonuria | Avoid or restrict diet sodas containing aspartame (FDA). | Authoritative guidance 11 |
| Pregnancy (caffeine in many sodas) | The NHS says not more than 200 mg of caffeine a day from all sources; the FDA says talk to a health care provider about limiting caffeine. | Authoritative guidance 13 12 |
| Children under 2 (caffeine) | The Dietary Guidelines, as quoted by the FDA, say drinks with caffeine should be avoided for children younger than 2. | Authoritative guidance 12 |
| Children and teens (sugary drinks) | Drinks with no added sugars should be the first choice (Dietary Guidelines, as quoted by the FDA). | Authoritative guidance 12 |
| Anyone with a history of kidney stones, diabetes, or very sensitive to caffeine | Ask your clinician about soda. These are cautions from observational studies and the FDA, not bans. | Observational and guidance 2 12 |
Overdose, product quality and regulators
Summary. Soda is a food drink, and serious poisoning from a normal can is not described in the sources read. The FDA estimates that toxic effects such as seizures can occur with rapid intake of about 1,200 mg of pure caffeine, which is far more than a soda contains.
Animal. Not researched.
High dose or long term signals. For aspartame, the joint WHO/FAO committee kept an acceptable daily intake of 40 mg per kg of body weight. Its example: an adult of 70 kg would need to drink more than 9 to 14 cans a day of a diet soft drink with 200 to 300 mg aspartame to pass it, if there were no other intake.
Overdose response. Call poison control or emergency services for seizures, fainting, chest pain or a very fast or irregular heartbeat.
Genotoxicity. Not researched.
Contamination of soda (for example benzene or heavy metals) was not researched for this page.
Caffeine content varies. The FDA lists 23 to 83 mg of caffeine in 12 fl oz of caffeinated soft drink, and says amounts in specific products and sizes vary. 12
| Body | Action | Date |
|---|---|---|
| US FDA (United States) | Consumer update: 400 mg a day of caffeine cited as not generally associated with negative effects in most adults; caffeinated soft drinks 23 to 83 mg per 12 fl oz; talk to a provider if pregnant or breastfeeding. source | 2024-08-28 |
| US FDA (United States) | Aspartame and other sweeteners: no safety concerns at approved use; people with PKU should avoid or restrict aspartame; saccharin regulated as a food additive since 1977 and approved for use in beverages under conditions. source | 2025-02-27 |
| WHO (International) | Guideline advises against non-sugar sweeteners for weight control or to reduce the risk of noncommunicable diseases (conditional recommendation; not for people with pre-existing diabetes). source | 2023-05-15 |
| IARC and WHO/FAO JECFA (International) | Aspartame: IARC Group 2B (possibly carcinogenic, limited evidence); JECFA kept the acceptable daily intake of 40 mg per kg of body weight. source | 2023-07-14 |
| WHO (International) | Healthy diet fact sheet: free sugars under 10% of daily energy; 5% or less may give extra benefit. source | 2026-01-26 |
| NHS (UK) (United Kingdom) | Pregnancy: no more than 200 mg of caffeine a day; estimates 40 mg in a can of cola. source | 2026-06-15 |
| American Heart Association (United States) | Science advisory: diet drinks may help adults cut sugary drink intake; prudent to advise against prolonged use by children; water preferred. source | 2018-08-28 |
When to get medical help
- Seizures, fainting, chest pain, a very fast or irregular heartbeat, or severe vomiting after a large amount of caffeine: get urgent medical help or call poison control.
Stop using the product and contact a clinician or emergency service. In the US, Poison Control is 1-800-222-1222.
General information only, not medical advice. Ask a clinician or pharmacist before use, especially with medicines, in pregnancy or with a health condition. See the Natural Remedy Safety guide.
Frequently asked questions
Does soda have any health benefits?
We found no health benefit shown in studies for regular soda. Its one nutritional contribution is calories from carbohydrate. This is a gap in research, not proof of no effect.
Does regular soda cause weight gain?
Pooled studies link sugar-sweetened drinks to weight gain. In small adult trials, adding them raised weight by about 0.85 kg. Cohort studies cannot prove cause, but trials and cohorts point the same way.
Does soda raise the risk of type 2 diabetes?
Is diet soda better than regular soda?
It has no calories, and the American Heart Association said it may help adults replace sugary drinks. But evidence is mixed: pooled trials found no significant BMI effect, cohort studies link diet drinks to more diabetes (much smaller after adjusting for body fat), and water is the preferred choice.
Does diet soda help with weight loss?
Is aspartame safe?
Does soda have caffeine?
Is soda safe in pregnancy?
Is soda bad for teeth?
Is cola bad for bones or kidneys?
Should children have soda?
What do I do if I react badly to caffeine?
The FDA lists fast heartbeat, palpitations, high blood pressure, insomnia, anxiety, jitters, upset stomach, nausea and headache as signs of too much. Talk with your health care professional if you have these. Seek urgent help for seizures, chest pain or fainting.
Explore by health goal
Weight ManagementBlood Sugar BalanceMetabolic HealthEnergy BoostHeart HealthBone HealthKidney HealthHealthy Teeth
Editorial transparency
- Written by
- AlternativeMed editorial team. Research compiled with AI assistance, then checked against the sources listed.
- Medical review
- None. This page has not been reviewed by a physician or pharmacist.
- First published
- 2026-10-26
- Last substantive update
- 2026-10-26
- How we research
- We started from our existing soda and diet soda summary, re-checked nutrition against saved USDA FoodData Central data, read the FDA, WHO and NHS pages and re-read PubMed abstracts for 10 papers. Only abstracts were read for studies. Items we could not verify are flagged in the research gaps.
- How we rate evidence
- See "How we rate evidence" in the Evidence tab.
- Independence
- No product is promoted on this page. No affiliate links are shown. Funding is not stated in most abstracts; one diet drink trial lists an author from a commercial weight-loss company.
Sources 18
Each source was opened and checked. Where we read only the abstract, it says so. The small numbers in the text point here.
- Azad MB, Abou-Setta AM, Chauhan BF, Rabbani R, et al.. Nonnutritive sweeteners and cardiometabolic health: a systematic review and meta-analysis of randomized controlled trials and prospective cohort studies.. CMAJ. 2017. PMID 28716847. DOI 10.1503/cmaj.161390. (abstract)
- Ferraro PM, Taylor EN, Gambaro G, Curhan GC.. Soda and other beverages and the risk of kidney stones.. Clin J Am Soc Nephrol. 2013. PMID 23676355. DOI 10.2215/CJN.11661112. (abstract)
- Guazzo R, Bressan E, Lehrkinder A, Campus G, et al.. An In Vitro and In Vivo Assessment of Acidogenicity of Several Alcoholic and Non-Alcoholic Beverages.. Clin Exp Dent Res. 2026. PMID 42830648. DOI 10.1002/cre2.70462. (abstract)
- Imamura F, O'Connor L, Ye Z, Mursu J, et al.. Consumption of sugar sweetened beverages, artificially sweetened beverages, and fruit juice and incidence of type 2 diabetes: systematic review, meta-analysis, and estimation of population attributable fraction.. BMJ. 2015. PMID 26199070. DOI 10.1136/bmj.h3576. (abstract)
- Johnson RK, Lichtenstein AH, Anderson CAM, Carson JA, et al.. Low-Calorie Sweetened Beverages and Cardiometabolic Health: A Science Advisory From the American Heart Association.. Circulation. 2018. PMID 30354445. DOI 10.1161/CIR.0000000000000569. (abstract)
- Juárez López MLA, Gutierrez-Moreno MF, Castrejón-Delgado L, Sánchez-Rodríguez MA.. Prevalence and Risk of Dental Erosion Linked to Carbonated Drinks in Adolescents: A Systematic Review and Meta-Analysis.. Oral Health Prev Dent. 2026. PMID 42113589. DOI 10.3290/j.ohpd.c_2619. (abstract)
- Malik VS, Popkin BM, Bray GA, Després JP, et al.. Sugar-sweetened beverages and risk of metabolic syndrome and type 2 diabetes: a meta-analysis.. Diabetes Care. 2010. PMID 20693348. DOI 10.2337/dc10-1079. (abstract)
- Malik VS, Pan A, Willett WC, Hu FB. Sugar-sweetened beverages and weight gain in children and adults: a systematic review and meta-analysis.. Am J Clin Nutr. 2013. PMID 23966427. DOI 10.3945/ajcn.113.058362. (abstract)
- Peters JC, Beck J, Cardel M, Wyatt HR, et al.. The effects of water and non-nutritive sweetened beverages on weight loss and weight maintenance: A randomized clinical trial.. Obesity (Silver Spring). 2016. PMID 26708700. DOI 10.1002/oby.21327. (abstract)
- Tucker KL, Morita K, Qiao N, Hannan MT, et al.. Colas, but not other carbonated beverages, are associated with low bone mineral density in older women: The Framingham Osteoporosis Study.. Am J Clin Nutr. 2006. PMID 17023723. DOI 10.1093/ajcn/84.4.936. (abstract)
- . Aspartame and Other Sweeteners in Food (US FDA). . . (full-text)
- . Spilling the Beans: How Much Caffeine is Too Much? (US FDA). . . (full-text)
- . Foods to avoid in pregnancy: caffeine (NHS). . . (full-text)
- . USDA FoodData Central: low-calorie carbonated beverage, cola or pepper-types, with sodium saccharin, contains caffeine (SR Legacy, FDC 171876). . . (full-text)
- . USDA FoodData Central: carbonated beverage, pepper-type, contains caffeine (SR Legacy, FDC 173209). . . (full-text)
- . Aspartame hazard and risk assessment results released (IARC and JECFA). . . (full-text)
- . Healthy diet (WHO fact sheet). . . (full-text)
- . WHO advises not to use non-sugar sweeteners for weight control in newly released guideline. . . (full-text)


